Case Studies Heavy Machinery Supplier Reduces Safety Incidents and Saves Money with the WSP
The Challenge
A heavy machinery supplier wanted to reduce the number of safety incidents that occurred at its facility, and to reduce the costs of safety claims associated with those incidents. The company was looking for a way to identify candidates in the recruitment process who were less likely to pose a safety risk at work.
The Solution
The organization partnered with Criteria to administer the Workplace Safety Profile (WSP) to its incoming job applicants. The Workplace Safety Profile is a risk assessment that measures a candidate’s attitudes towards safety, predicting the likelihood that someone may cause an accident or injury in the workplace.
After using the WSP for three years, however, some of the organization’s hiring managers did not believe that the WSP added value to the recruitment process. This led to some managers ignoring the assessment and hiring people regardless of the results.
The organization asked Criteria to conduct a study to evaluate the WSP’s ability to predict safety outcomes. Criteria reviewed the WSP results and employee records of 1,243 employees to determine how effectively the assessment predicted safety incidents. Employees were split into two groups: High Risk (scoring below the 20th percentile on the WSP) and Low Risk (scoring above the 20th percentile).
The Results
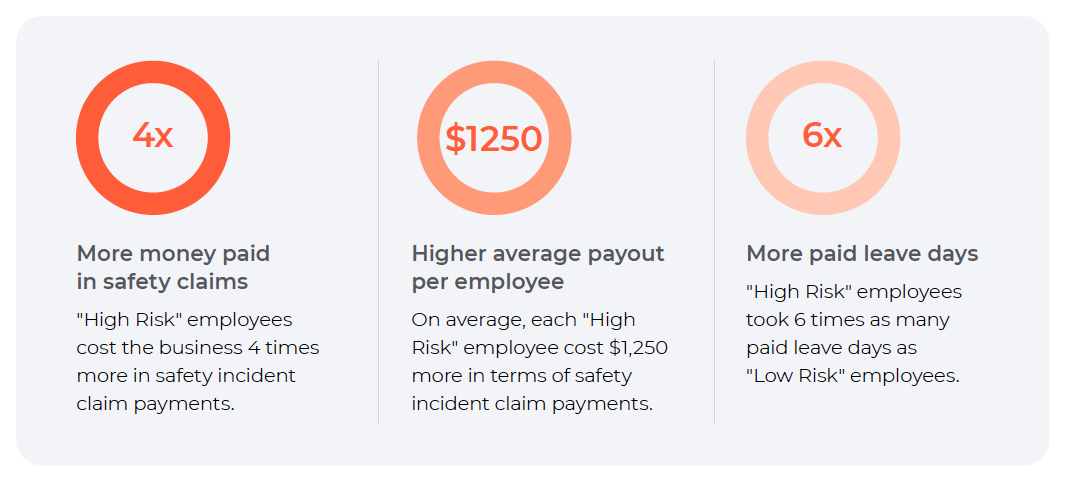
We identified that, even though only a small percentage of employees fell into the “High Risk” category, those people were responsible for a disproportionate number of incidents, and were costing the business much more than the “Low Risk” employees. In fact we found out that:

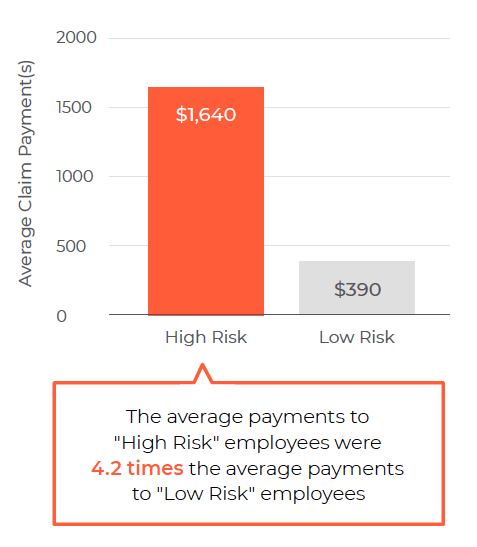
Safety Incident Claim Payments
We looked at the average cost of safety incident claim payments per employee, and found that the average cost per claim for "High Risk" employees was $1,640, while the average cost per claim for "Low Risk" employees was $390.

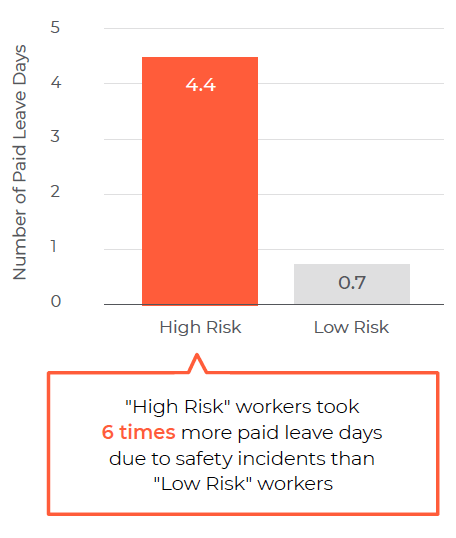
Paid Leave Days
We also examined the average number of paid leave days for each employee group. On average, "High Risk" employees took 4.4 paid leave days due to safety incidents, while "Low Risk" employees took 0.7 days.

The previously skeptical hiring managers agreed to pay attention to the results of the WSP in the future when hiring new employees. The entire company also amended its process to automatically screen out people achieving a “High Risk” score on the WSP.
